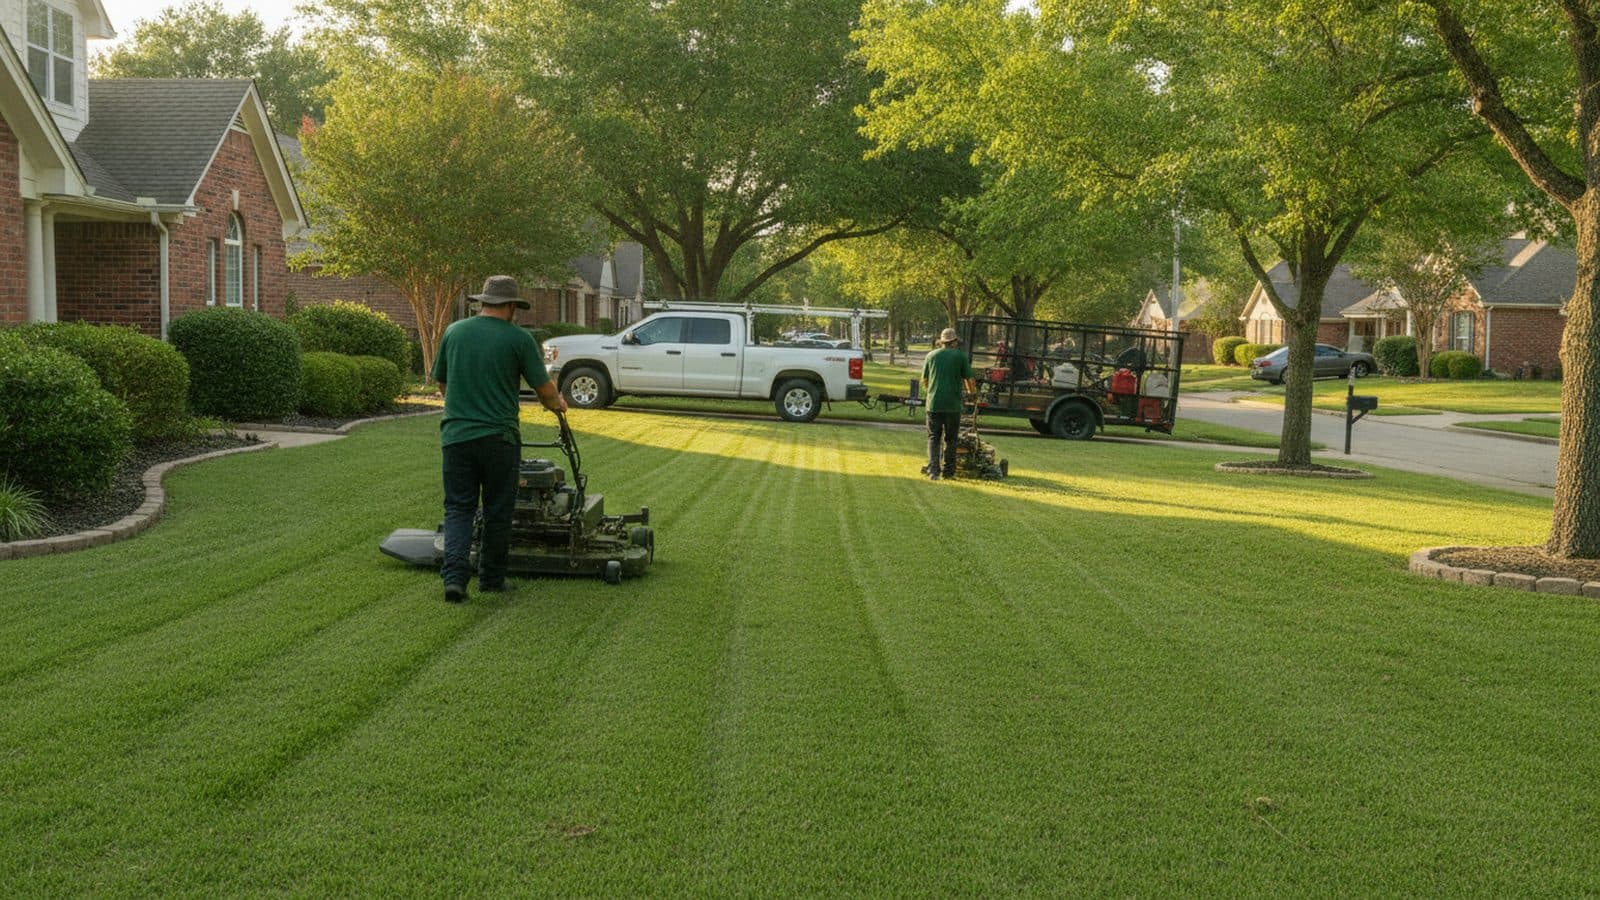
How route density affects landscaping profit margins
A landscaping company can add accounts and still get poorer.
The P&L does not care how many pins you dropped on the map. It cares how much of every paid hour turned into an invoice. When those pins are scattered, labor as a percent of revenue climbs, net margin shrinks, and a busy week still feels tight. When the same number of homes sit on a few streets, the opposite happens: more billable minutes, a lower labor ratio, and a wider gap between what you charge and what you keep.
This article is about that gap. The companion piece, how much drive time costs a landscaping company, puts a dollar on windshield time. This one shows where that leak shows up on the income statement.
Where the industry actually sits
Public 2026 benchmarks cluster in a narrow band:
- Net profit: most operators land around 8 to 12 percent. IBISWorld sits near 12 percent. NALP surveys report the same band. Level's 2026 note also shows a wider 5 to 10 percent median and a 12 to 18 percent top quartile. Bottom quartile is under 5 percent. The spread is the story.
- Maintenance gross margin: a common composite sits near 50 percent. Under 35 percent is bottom quartile. Above 58 percent is top.
- Labor as a percent of revenue: 50 to 58 percent is the middle. Level treats anything above 58 percent as a warning, and puts top operators at 45 to 50 percent.
Those are industry analyses, not BlockBundle customer results. Treat them as a ruler, not a promise.
Labor is the largest line on a maintenance P&L. The difference between a 5 percent shop and a 15 percent shop is often not a cheaper crew. It is how much of that crew's day is spent cutting grass instead of sitting in a truck. On a $1 million company, every net-margin point is $10,000. That is why density belongs in the finance conversation, not just dispatch.
Labor percent is the margin lever - not the wage rate
A $20-an-hour crew lead who spends 90 percent of the shift on the property is cheaper than a $16-an-hour lead who spends 70 percent of the shift driving. Wage rate is visible. Billable-hour rate is what hits net.
Drive time is paid labor that produces no invoice. So is the second unload of the same mower three streets over. Both inflate labor as a percent of revenue without changing the hourly wage or the price on the work order.
That is why adding revenue can make the ratio worse. A new account 25 minutes off the existing route adds a full hop of unbilled labor to every visit. Revenue goes up. Labor goes up faster. Gross margin on that stop is thin, and the rest of the day's stops get later. The shop looks busier. The labor percent ticks toward 58, then past it.
Grow Group, writing from an operating landscape company, puts the same idea on a map: 50 properties clustered in a few neighborhoods versus 50 spread across 30 miles. Their illustration has the dense book doing 12 jobs a day with about 1.5 hours of drive time, and the scattered book doing 8 jobs with about 4.5 hours in the truck. Treat that as their example, not a measurement of your routes. Same account count. Different day. Different margin.
A worked example: the same crew, two maps
The numbers below are an illustrative example. Swap in your price, your crew cost, and your real hops.
Shared assumptions
- One two-person crew
- Eight stops a day on a loose route, nine if the hops shrink
- $55 average ticket (mow, edge, blow on a typical residential lot)
- 5-day week, 30-week mowing season (150 working days)
- Field wages only, at the U.S. median of $18.82 per hour for landscaping and groundskeeping workers (BLS / O*NET, 2025) - $37.64 per hour for two people, not loaded for payroll tax or workers' comp
Loose map: about 10 minutes between stops. That is 80 minutes of inter-job driving, or roughly 1.3 hours of wages that never hit an invoice.
Dense map: about 2 minutes between neighboring homes. That is 16 minutes of inter-job driving. The recovered 64 minutes is the slot for a ninth stop on a street you already serve.
| Line | Loose map (8 stops) | Dense map (9 stops) |
|---|---|---|
| Daily revenue | 8 × $55 = $440 | 9 × $55 = $495 |
| Seasonal revenue | $66,000 | $74,250 |
| Daily field wages (8-hour shift) | $301 | $301 |
| Seasonal field wages | $45,168 | $45,168 |
| Field wages as % of revenue | 68% | 61% |
Same crew. Same wage. Same truck. $8,250 more seasonal revenue and a 7-point drop in the field-wage ratio, before payroll burden, fuel, or overhead. Loaded labor would move both percentages down, but the gap stays. The extra stop did not require a longer day. It required a tighter map.
This is the same recovered hour Level uses when it says a crew spending 60 minutes between jobs instead of 20 loses more than an hour of billable time a day, or roughly $18,000 to $28,000 in lost revenue per crew over a 30-week season. Their range assumes a higher billing rate than the $55-ticket example. The mechanism is identical.
Why "more leads" is a weak margin plan
The usual reaction to a thin year is more marketing.
If the next ten leads land across town, you bought revenue that raises labor percent. You also paid to acquire each house as a one-off. Price cuts do not fix a map. They hide it for a season.
Before you spend on another channel, pull last week's stops and mark which ones sat on a street you already served that day. Then price the next account two ways: on a street you already drive, and 20 minutes off it. Keep the well-located one even if the ticket is the same.
Level's rule of thumb: one well-located account on a street you already serve is usually worth more than two scattered new accounts. That is a density point, not a volume point. The second scattered account looks like growth. The first clustered one is the one that moves net.
How to read your own labor percent this month
You do not need a new accounting system to see whether density is your problem.
- If labor is above 58 percent of revenue, start with the map, not the wage scale. Time the minutes between stops for one crew for one week.
- If maintenance gross margin is under 50 percent, check whether estimates assume a tight hop and actuals include a long one.
- If revenue is up and net is flat or down, you likely added the wrong accounts.
Fuel will show up. It is not the main line. The IRS optional business mileage rate for the second half of 2026 is 76 cents per mile. On a loose eight-stop day at 5 miles between jobs, that is about $30 in vehicle cost. On a dense street at 0.2 miles between homes, it is about $1. Real, and still smaller than the wages in the same hops. Full mileage math is in the drive-time cost breakdown.
How BlockBundle feeds denser routes without you organizing the block
BlockBundle is not a lead marketplace that drops random pins on your week.
You draw the streets you actually cover and set your per-square-foot rate plus a route cost. Homeowners on those streets book individually. When neighboring homes book, the work arrives already clustered - several properties you can serve in one trip. You are not lowering your price to win the street. You are lowering the cost of serving it and keeping the difference.
We will not quote a volume, an earnings figure, or a guaranteed margin lift. We launch in Collin County first - McKinney, Trinity Falls, and the inner-ring DFW towns around them - so the first clustered routes sit on streets a crew can actually keep. Those numbers have to come from live routes. What the table already says: margin moves when the next stop is next door.
The product version is how providers book whole-street routes at the price they set. The homeowner-facing explanation is what home-service bundling is. The booking flow is how BlockBundle works.
Sources
- Level - Landscape Company Benchmarks (2026): net 8-12% typical, labor 50-58% of revenue, $18k-$28k lost revenue per crew from loose hops: https://levelcfo.com/benchmarks/landscaping/
- Level - 2026 Landscaping Benchmarks PDF (median vs. top-quartile net spread; labor as the central problem): https://www.levelcfo.com/downloads/level-landscaping-benchmarks-2026.pdf
- The Grow Group - Profit Margins for Landscaping Businesses Explained (clustered vs. scattered book; 5-15% healthy net band): https://www.growgroupinc.com/the-grow-group-blog/profit-margins-for-landscaping-businesses-explained
- O*NET / BLS - Landscaping and Groundskeeping Workers (37-3011.00), median wage $18.82/hour (2025): https://www.onetonline.org/link/summary/37-3011.00
- IRS - Standard mileage rates (July 1–December 31, 2026 business rate, 76 cents/mile): https://www.irs.gov/tax-professionals/standard-mileage-rates